
Q1 2018 Review

Anuar Ustayev

Rufus Pollock
akariv
We're sharing an update on all the progress we made in the first quarter of 2018. We massively improved our data command line tool, sped up data deployment 5-100x and introduced embeddable shareable data tables and visualizations. We welcome feedback and ideas on how to keep improving the platform.
Polishing data command line tool and QA
Q1 focused on polishing the data push flow and starting to improve the funnel of take up. We also improved data tool generally and added a few new features in the frontend such as embeddable tables and views.
On data tool we did a lot of work on QA. We put in place a new QA process including a full breakdown of key processes, a new, more comprehensive testing system plus a new method for tracking issues in github.
Summary of QA stats (as for 29 Mar 2018):
- Total test cases: 203
- Automated: ~50
- Manual: ~150
- Opened issues: ~100
- Closed issues: ~70
The graph above illustrates number of open issues by severity.
Issue trackers:
- QA repo (and the main issue tracker) is now located at :github: https://github.com/datahq/datahub-qa/issues
- We also have issue tracker dataset - :datahub: https://datahub.io/examples/datahub-qa-issues-tracker
Fixes and features
Data Factory
- Processing speed improvements i.e. processing of 1MB CSV file was decreased from 45s to 29s and we're still working on it to make it even faster. During this process it validates and normalizes the dataset + generates cleaned CSV and JSON version of each tabular data file and ZIP version of a data package which also contains validaiton report.
- Excel processing improvements - fixes for various bugs related to different coercion of data types in JS vs Python. This fix should enable publishers to work with most of data types in the Excel.
data command line tool and associated JS libraries
- Windows version of the CLI and improved release management.
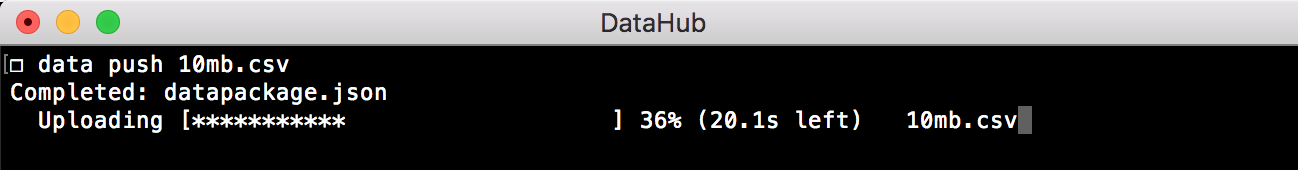
- Progress bar on push so publishers have better UX while their files are being uploaded:
- Parsing and ingest:
- support for various CSV delimiters such as semicolons, colons, pipes, tabs etc.
- support for various encodings
- Skipping uploading files if already uploaded which dramatically improves push performance on repeated deployments.
validatecommand improvements: users now see process details, e.g., which file is being validated - useful when your data package has lots of files: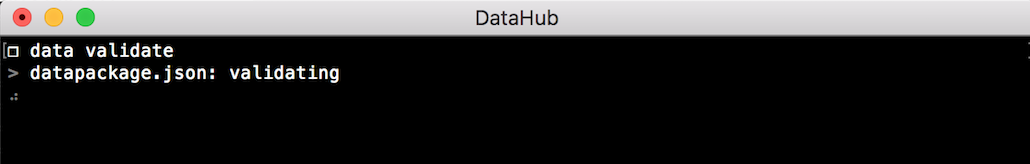
infocommand improvements: support for non-tabular files and improved information about datasets: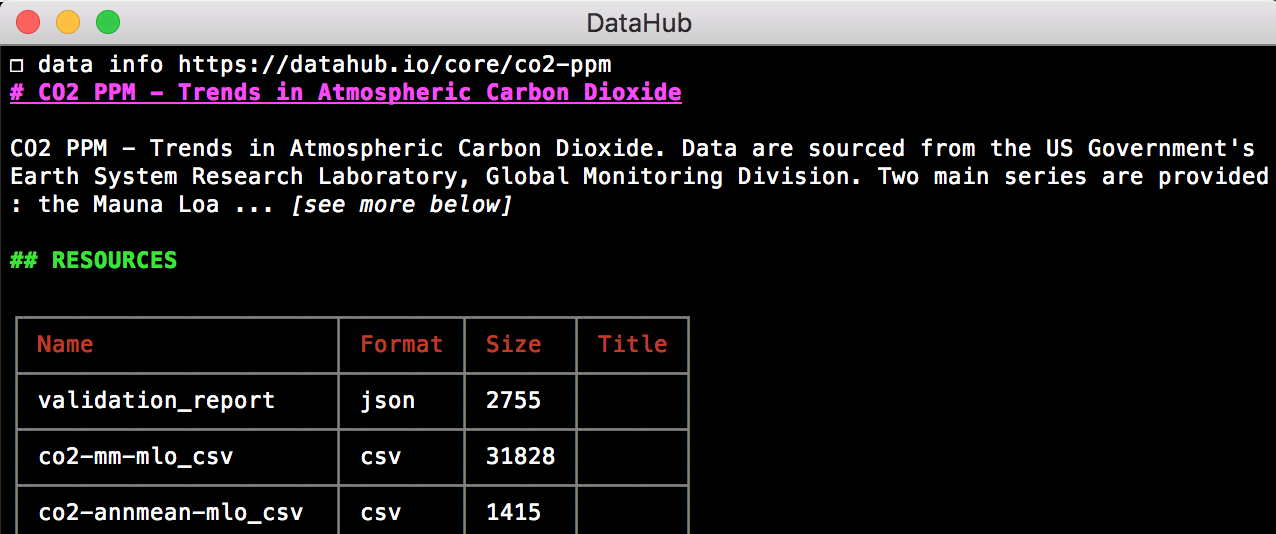
getcommand works with files from GitHub and DataHub + getting datasets from Datahub now downloads zip version and unzips it for you.catcommand works with streamed data, e.g., fromstdin: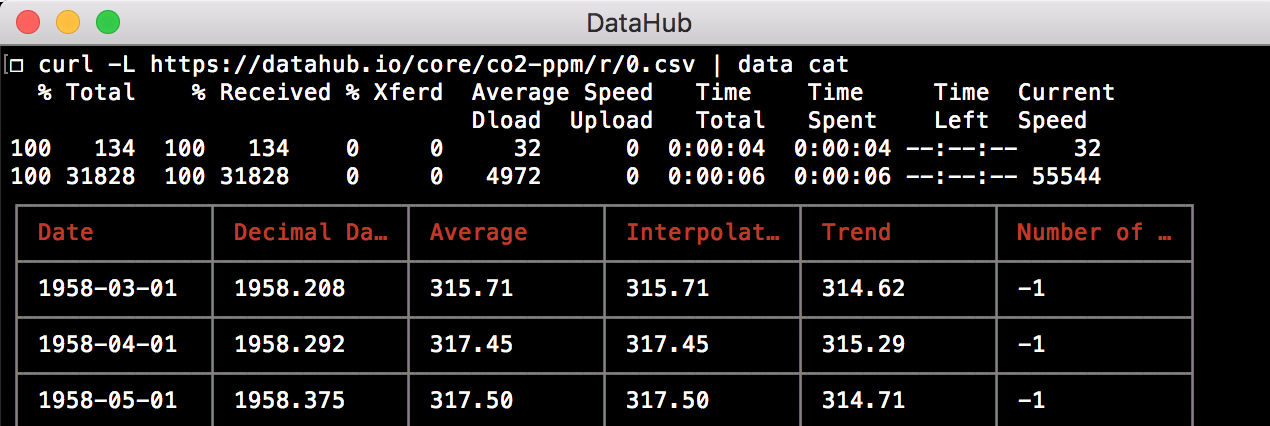
- Error handling and messaging improvements throughout the CLI app.
Frontend
- Shareable and embeddable views + HTML tables, read more about it here https://datahub.io/blog/new-features-and-improvements
- Search improvements, e.g., now we're ignoring stop words.
- Extended and improved instructions for using datasets from different programming languages and tools - now we have ready to use instructions for
data-cli,curl,R,Python,PandasandJavaScript. - Pagination on search and publisher pages as number of datasets on DataHub have increased.
- Search in publisher page - now you can search datasets from specific publisher (e.g., core datasets - https://datahub.io/core).
- Support for custom axis titles and suffixes in the ticks, which is important when you're creating graphs, read more about it here https://datahub.io/docs/features/views#axis-titles-and-suffixes-for-axis-ticks
Docs
- Ability to give feedback or contribute to the docs, e.g., see https://datahub.io/docs/getting-started/installing-data - you can easily improve this docs article now.
- Improved docs with GIFs so users understand how things work, e.g., see https://datahub.io/docs/getting-started/publishing-data
- Improved and extended documentation about different commands
Summary
In the Q1, the DataHub team focused on making the tools stable and useful for people - it was productive and exciting start of the year! There is a lot to be done in the Q2 so stay tuned for new updates and features!